mapsDay 5 – Earth – Fuego and Acatenango Volcanoes
Day 5 – Earth 🌎
Challenge Description: Focus on the tangible and grounded. Map landforms, geology, soil, agriculture, elevation, or anything solid beneath your feet.
My Submission 🌋
I’ve always thought 3D maps looked super cool, but also kind of hard to make. While browsing fun creations from the #30DayMapChallenge on Twitter/X, I came across an amazing R library called rayshader developed by Tyler Morgan-Wall. It’s incredibly powerful and can generate some stunning visualizations. I also discovered a plugin called rayvista, which makes data retrieval and 3D modeling so much easier — literally just one line of code.
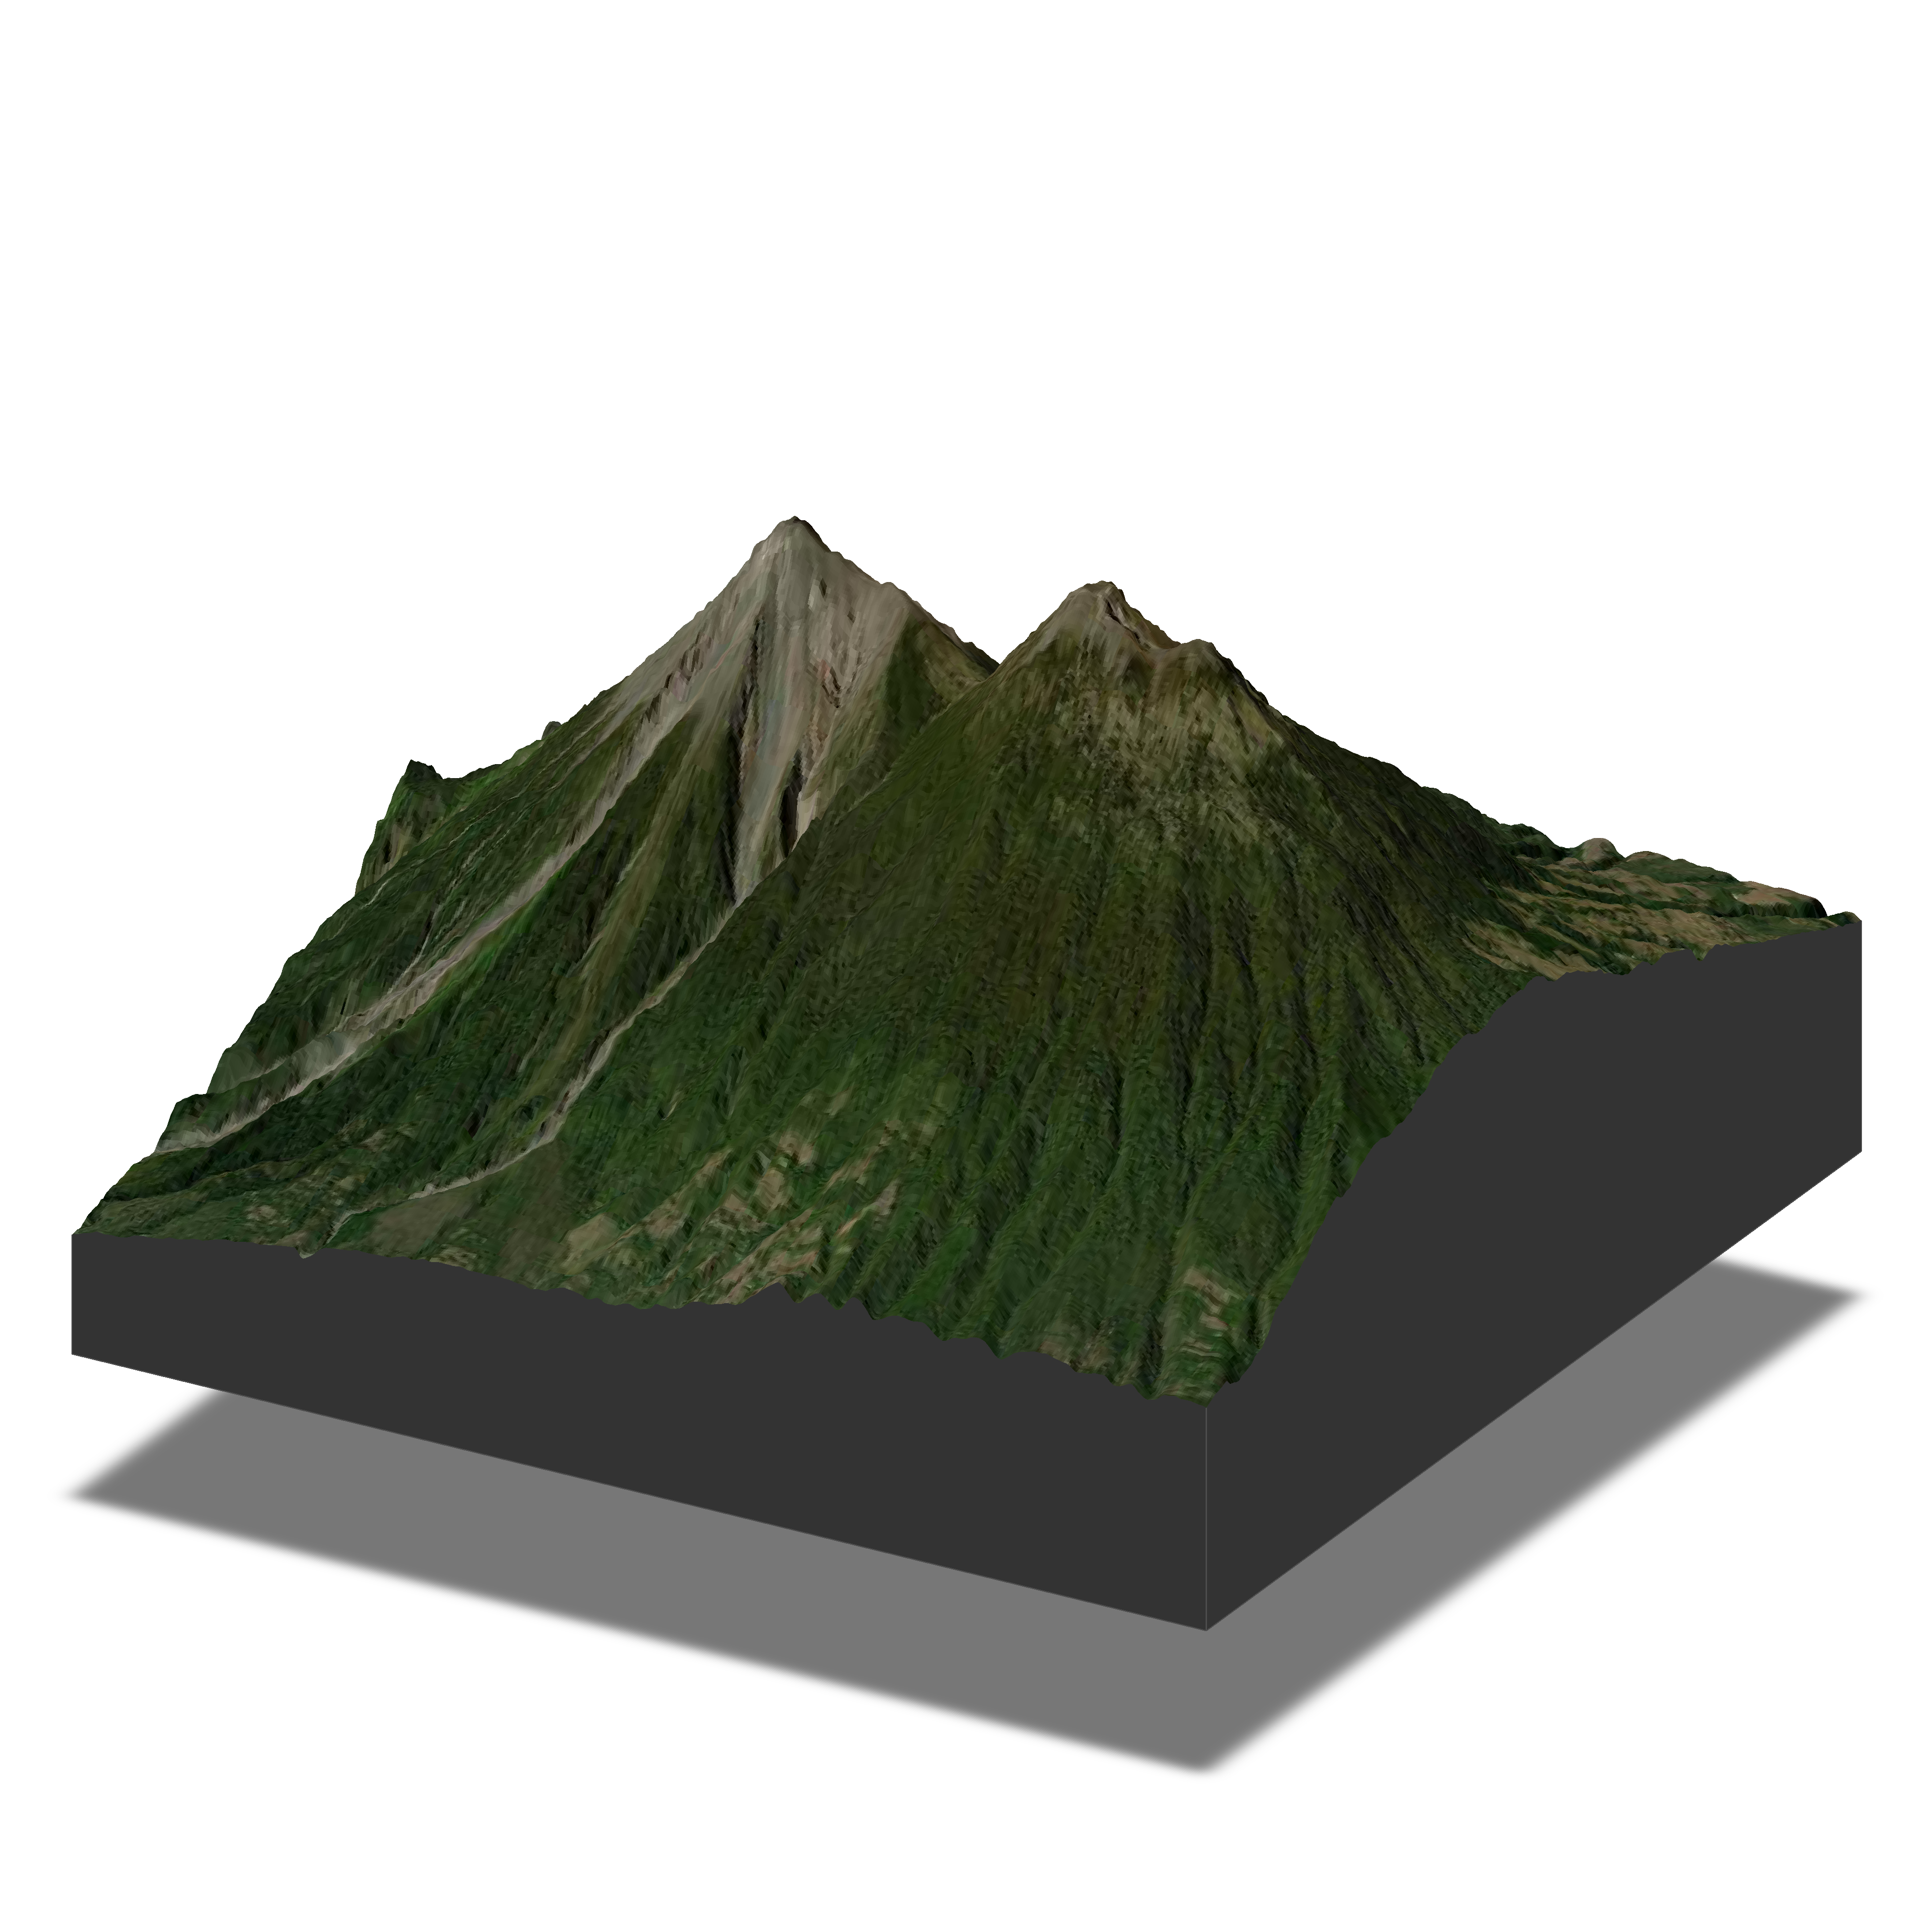
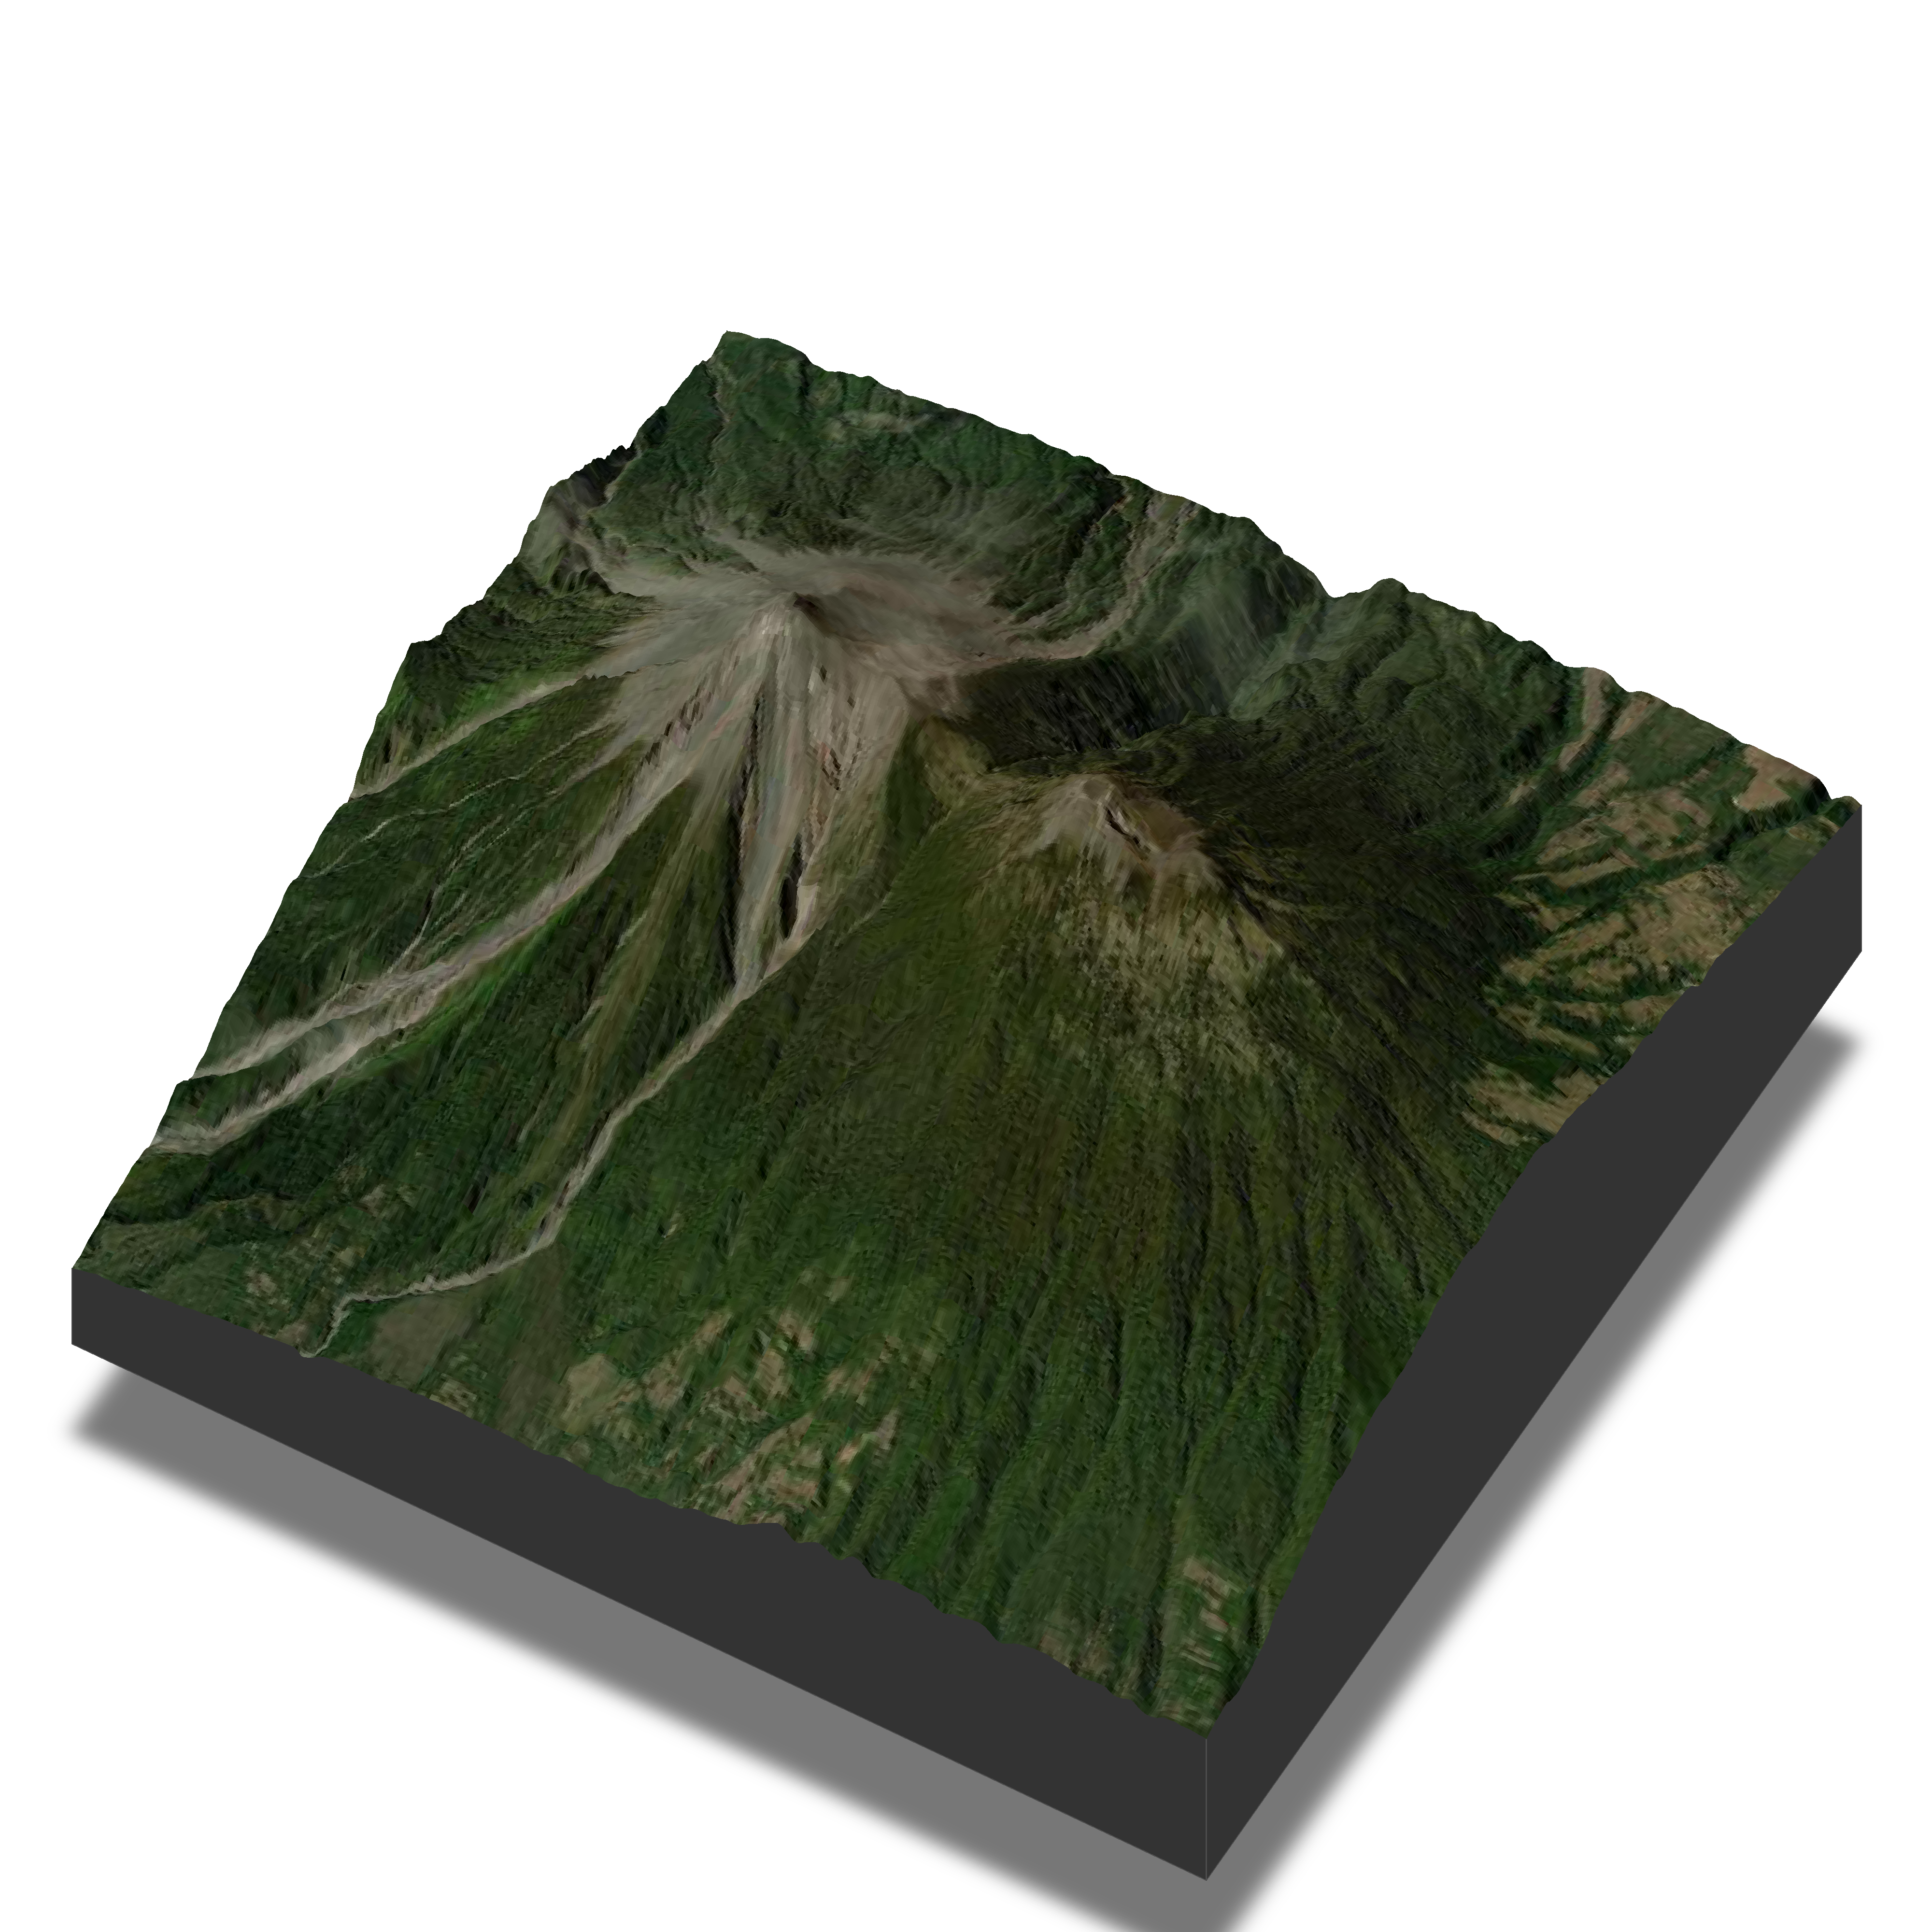
I definitely want to explore more with rayshader moving forward, but to start off, I made the two maps below using rayvista, featuring the Fuego and Acatenango volcanoes in Guatemala. I’ll be visiting them this Thanksgiving (counting down the days!).
In each image, the left volcano is Fuego covered with grey ash; the right one is Acatenango. The two images show the same scene from different camera angles.
About Fuego and Acatenango
Fuego (see location and images) is an active volcano — you can actually see its lava glowing at night.
Acatenango (see location and images), right next to it, is dormant.
The usual hiking route is to climb Acatenango first and camp overnight at its basecamp there. Then, around 4 a.m. the next day, hikers go down a bit and continue up Fuego to watch it erupt up close.
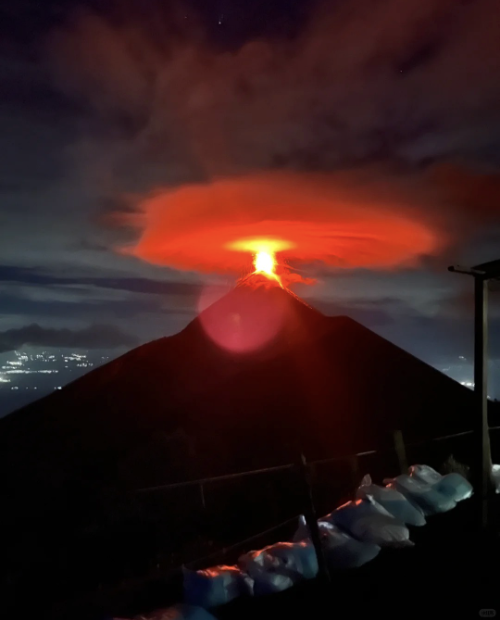
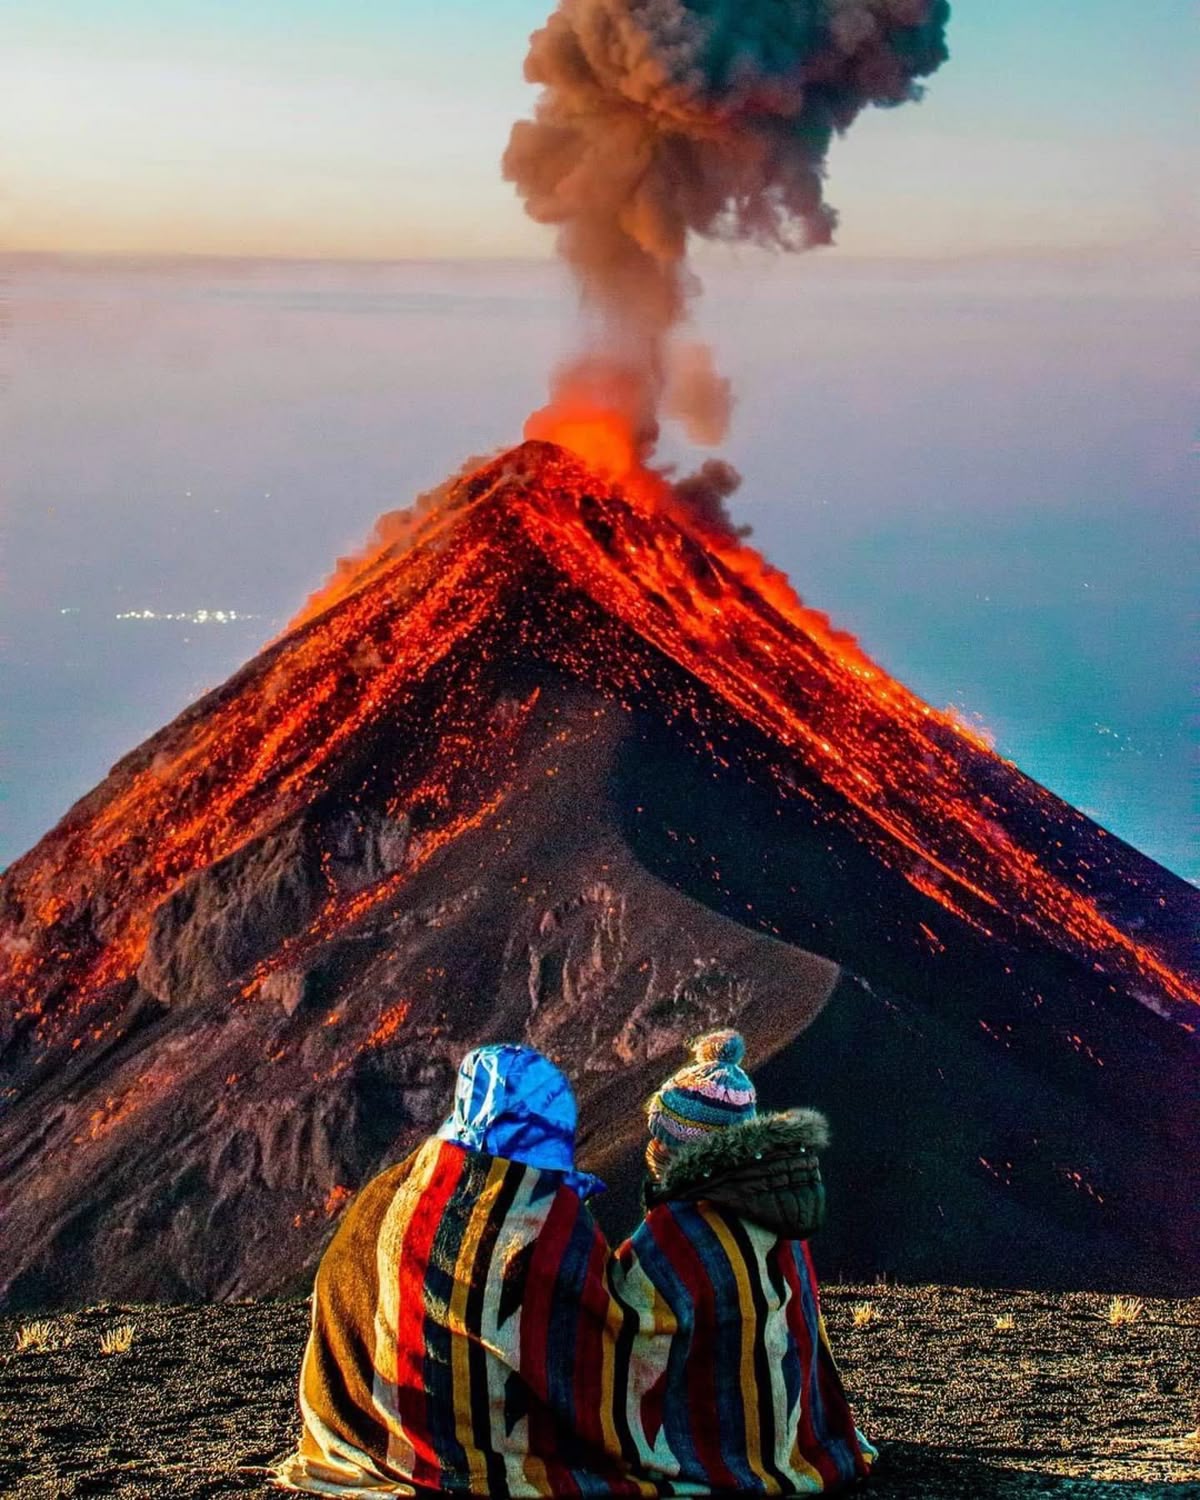
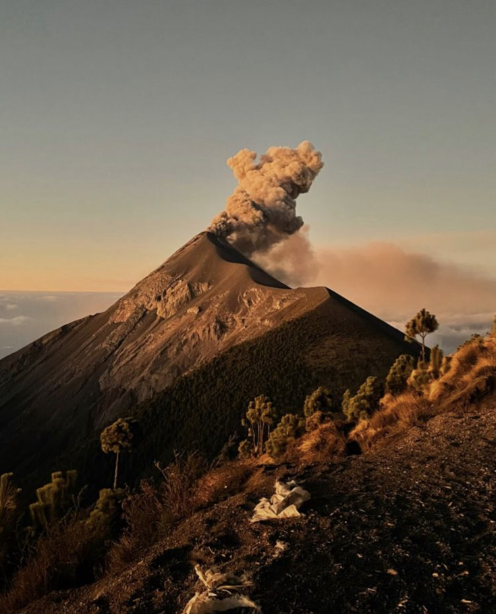

(Above images are from the internet.)
R Code Snippet
Since it’s super simple to make, I’m sharing the code below:
# Suppose you’ve already installed the packages
library(rayvista)
library(rayshader)

# --- First map (left) ---
plot_3d_vista(
  lat = 14.489341,
  long = -90.877826,
  radius = 5000,      # meters
  z = 5,              # DEM detail level
  theta = 125,        # direction
  phi = 25,           # camera angle
  zoom = 0.8
)

render_snapshot(
  filename = "fuego_acatenango_1.png",
  clear = TRUE,
  title_text = NULL,
  width = 4000,
  height = 4000,
  background = "white"
)

# --- Second map (right) - higher viewpoint ---
plot_3d_vista(
  lat = 14.489341,
  long = -90.877826,
  radius = 4500,      # meters
  z = 5,              # DEM detail level
  theta = 125,        # direction
  phi = 55,           # higher angle
  zoom = 0.8
)

render_snapshot(
  filename = "fuego_acatenango_2.png",
  clear = TRUE,
  title_text = NULL,
  width = 4000,
  height = 4000,
  background = "white"
)

# I tried many times to find the view I liked the most!
References
-
Twitter X user @researchremora
Made by Matt Zhu for the #30DayMapChallenge.